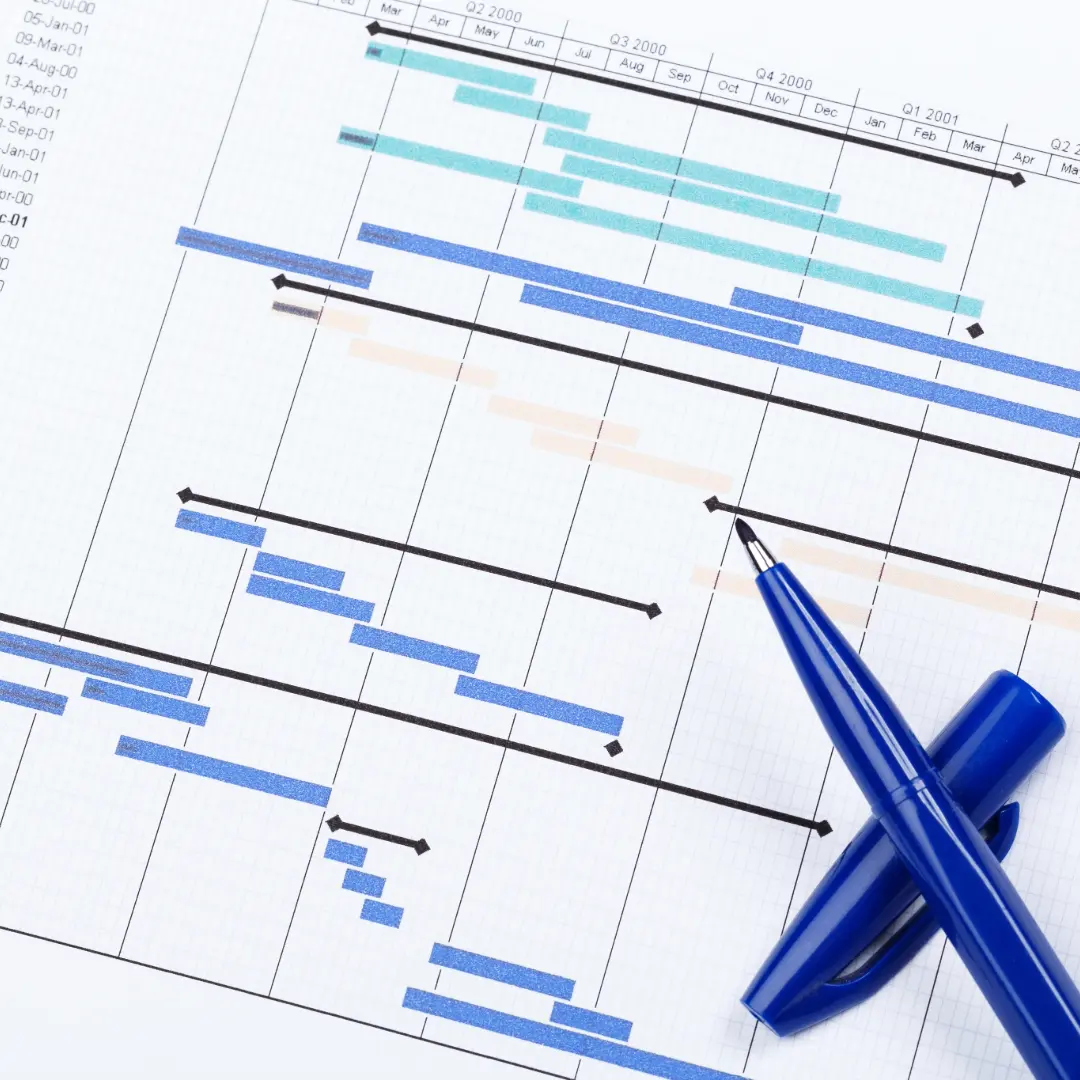
Project planning and site control are essential for avoiding delays, cost overruns and disputes between contractors. Poorly scheduled projects tend to end in time extensions, contractual penalties and lost profitability. The Gantt chart has established itself as one of the most effective tools for construction project management, because it lets you visualise the project schedule, coordinate work packages and activities, control physical and financial progress, and anticipate risks.
Its application is key in projects such as:
- Residential: low rise and high rise development
- Infrastructure: urban and road projects
- Public works
- Industrial and commercial construction
What is a Gantt chart?
A Gantt chart in construction is a graphic tool that displays the project schedule, representing each activity or work package on a timeline and showing its duration, sequence and dependencies.
What is a Gantt chart used for in construction?
It is used to:
- Plan the complete development of a project
- Organise construction activities by phase
- Identify dependencies between work packages
- Track timelines, physical progress and responsible parties
- Communicate the schedule to contractors and clients
Construction terminology glossary
- Work package: a group of similar activities within the project.
- Milestone: a key project event with no duration.
- Critical path: the sequence of activities that determines the total duration of the project.
- Progress claim: a document reflecting physical and financial progress.
- Physical progress: the actual percentage of completion.
- Project schedule: the overall programme of the project.
In practical terms, the Gantt chart becomes the operational map of the project, both in the office and in the field.
Benefits of the Gantt chart in construction projects
Used properly, a Gantt chart delivers real, measurable benefits on site:
Phase by phase planning. It splits the project into clear stages: preliminaries, structure, building services, finishes and handover.
Coordination between contractors and subcontractors. It makes the correct sequence between trades easier to hold, from masonry to electrical, plumbing and drainage work.
Control of time, resources and physical progress. It compares actual progress against the planned schedule, so variances show up early.
Prevention of delays and penalties. It identifies critical activities and avoids the bottlenecks that put the handover date at risk.
Better progress claims and site tracking. A well structured Gantt chart backs up claims, reports and progress meetings.
Use cases for the Gantt chart in construction
Planning from kickoff to handover. From the start of works meeting to final delivery, the Gantt chart sets the contractual timeline and the key dates.
Weekly and monthly site control. It is what gets reviewed in site meetings: progress, delays and the activities coming up next.
Coordination of building services. It prevents clashes between electrical, plumbing, drainage and specialist installations.
Reports to clients and public authorities. It is the standard tool for justifying physical and financial progress on public works.
How to build a Gantt chart step by step
The scope, the breakdown of activities, the duration, the sequence and the party responsible for each work package are all defined as part of the project schedule. With that information ready, building the Gantt chart follows these steps:
Set the time scale. Decide whether the horizontal axis is divided into days, weeks or months, depending on the total duration of the project and the level of detail you need to follow it.
Turn every work package into a bar. Each activity in the breakdown is placed on the timeline according to its start date and its duration, forming a horizontal bar.
Mark the dependencies between bars. Connect the activities that depend on each other, so that a delay in one task is reflected automatically across the rest of the schedule.
Identify the critical path. This is the chain of dependent activities that determines the total duration of the project: a delay in any of them delays the whole job, unlike a task that has float.
Set the key milestones. Kickoff, phase handovers and completion are marked as points with no duration inside the same chart, which makes them a quick reference in progress meetings.
Update actual progress as the work advances. A Gantt chart that does not reflect what the site reports stops being useful for decisions within a few weeks of starting.
This is what a construction Gantt chart looks like in Trowel
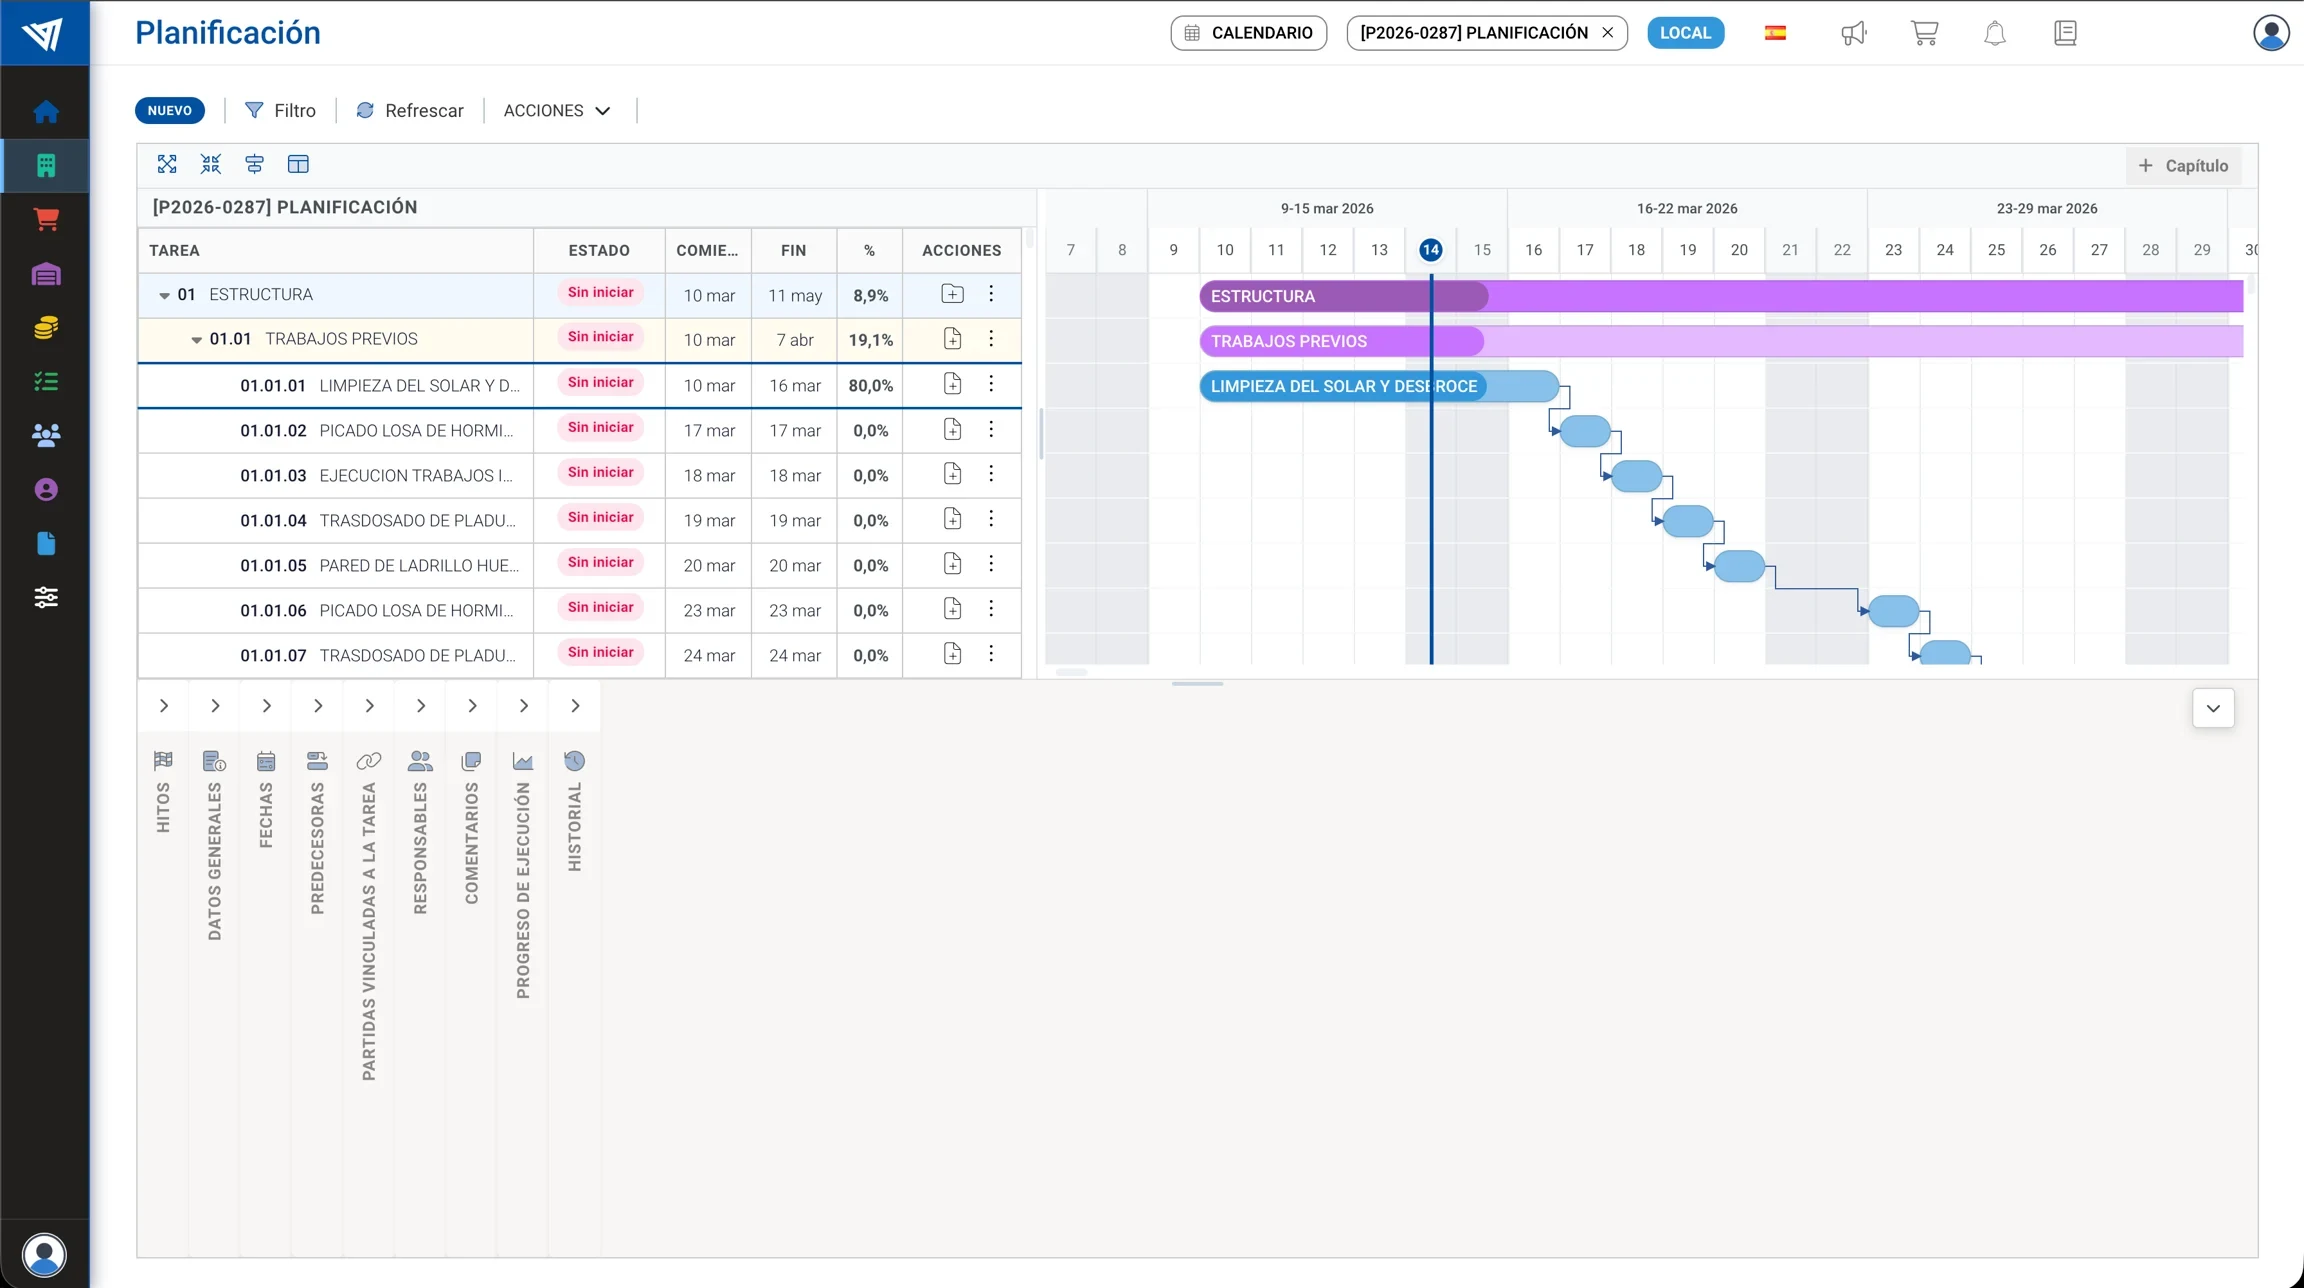
Each chapter (Structure, Preliminaries) groups its own work packages, and every package has its own bar with a start date, a finish date and a percentage of progress. The work breakdown structure from step 2 and the duration and sequence from step 3 end up represented in a single view, with no separate document to keep in sync. The arrows connecting the tasks show the dependencies, so when an activity slips it is immediately visible which other tasks are affected.
Common mistakes when using a Gantt chart on site
Building it once and never updating it. A chart that does not reflect actual progress stops being useful for decision making within a few weeks of starting on site.
Not defining dependencies between activities. Without marking which task depends on which, the chart becomes a list of dates without the sequence logic that actually drives the completion date.
Breaking the work down too far, or not far enough. A chart with hundreds of microscopic tasks is impossible to keep up to date; one with five generic bars is useless for coordinating daily work. The right level of detail depends on who is going to use it and what for.
Drawing it up without the people who execute the work. A programme built in the office alone, without checking realistic durations with the site team, tends to underestimate how long certain activities actually take.
How Trowel helps
| Problem | How Trowel solves it |
|---|---|
| Updating the Gantt chart by hand every time a date, a task or a predecessor changes | It is the main view of planning inside the platform, and it updates automatically when any of those elements change |
| Not having the activity breakdown, the dates and the progress of each task in one place | It shows the start and finish of every task in a bar chart, with dependencies, progress and status visible at the same time |
| Keeping the work breakdown structure in a document separate from the visual schedule | The grid on the left, with the tree of blocks and tasks in configurable columns, sits next to the timeline in the same view |
The view is organised into four areas: the toolbar for expanding blocks and centring the view on today, the grid with the task tree, the timeline with the bars themselves, and a detail panel that opens when you select any task or block. The full documentation is available in Trowel Academy.
Frequently asked questions
What is the difference between a Gantt chart and a project schedule?
In practice there is no real difference: the project schedule is the overall plan of the works, and the Gantt chart is the most common way of representing it visually over time.
How often should the Gantt chart of a project be updated?
Weekly is the sensible rhythm, comparing the actual progress captured in site reports against the plan, and adjusting the chart when the variance justifies it. A chart that is not updated stops reflecting reality within a few weeks.
Is a Gantt chart worth it on small projects?
Yes. Its value is more obvious on projects with many dependencies between work packages, but even a small job benefits from having its activities sequenced in time instead of coordinated from memory or through scattered messages.
Conclusion
The Gantt chart is a key tool for planning and controlling construction work, because it organises activities, coordinates contractors and keeps track of progress. Used properly, it reduces delays, optimises resources and improves decision making. Book a Trowel demo and see the Gantt chart connected directly to your budget and to the reports coming from site.